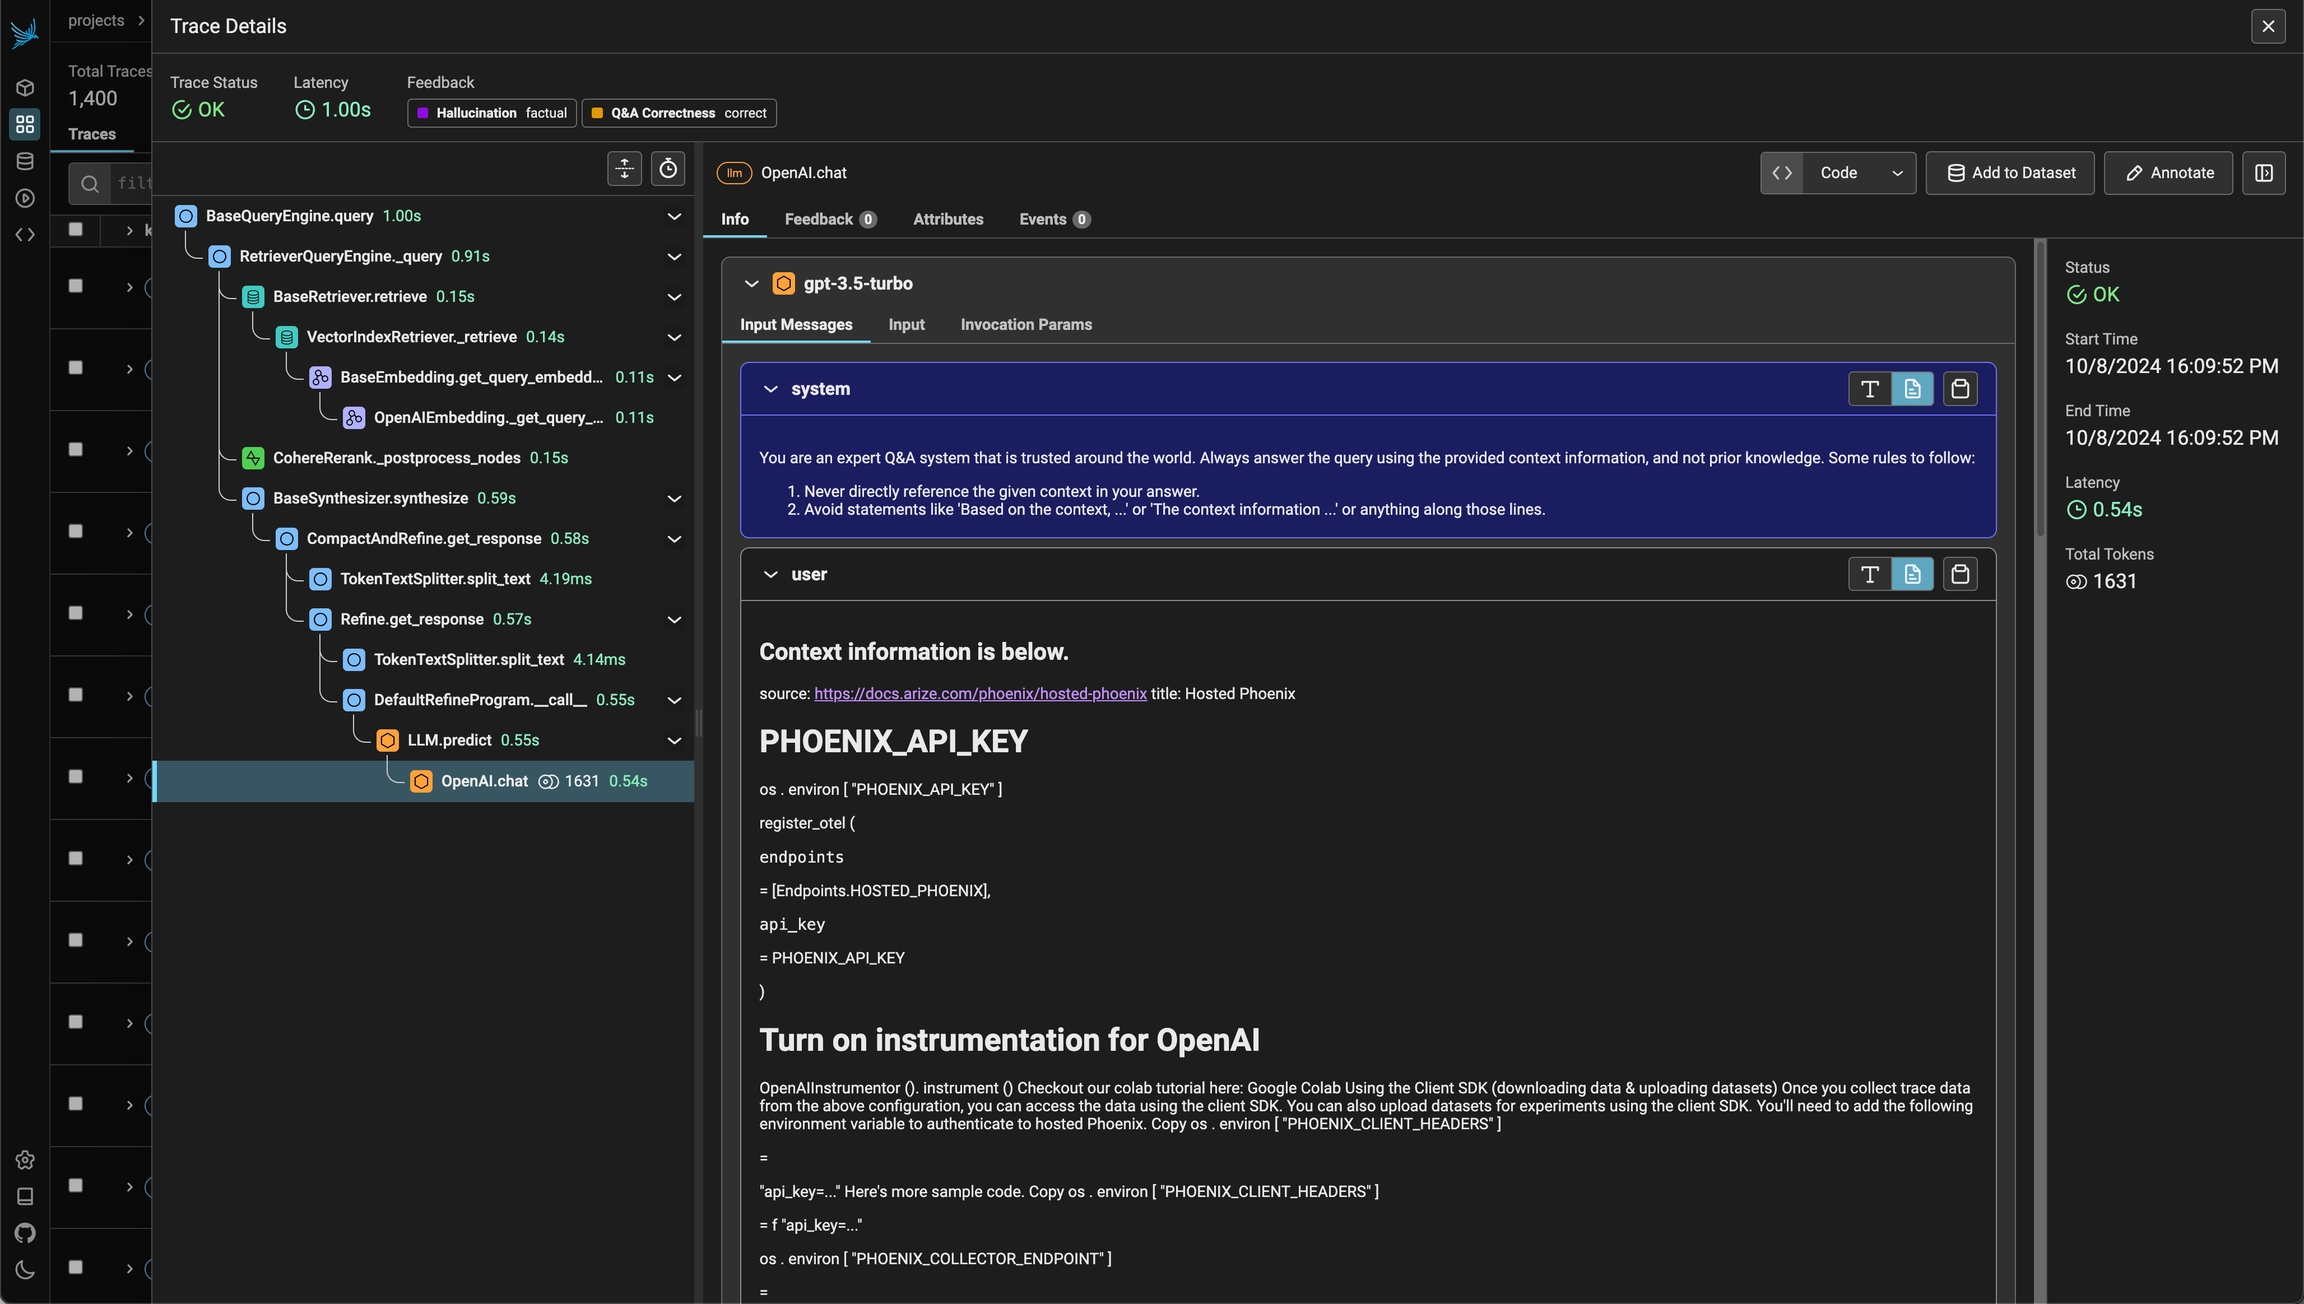
Phoenix traces AI applications, via OpenTelemetry and has first-class integrations with LlamaIndex, LangChain, OpenAI, and others. LLM tracing records the paths taken by requests as they propagate through multiple steps or components of an LLM application. For example, when a user interacts with an LLM application, tracing can capture the sequence of operations, such as document retrieval, embedding generation, language model invocation, and response generation to provide a detailed timeline of the request’s execution. Tracing is a helpful tool for understanding how your LLM application works. Phoenix offers comprehensive tracing capabilities that are not tied to any specific LLM vendor or framework. Phoenix accepts traces over the OpenTelemetry protocol (OTLP) and supports first-class instrumentation for a variety of frameworks ( LlamaIndex, LangChain, DSPy), SDKs (OpenAI, Bedrock, Mistral, Vertex), and languages. (Python, TypeScript, etc.)Documentation Index
Fetch the complete documentation index at: https://arizeai-433a7140-mikeldking-12899-providers-and-secrets.mintlify.app/llms.txt
Use this file to discover all available pages before exploring further.
- Application Latency: Identify and address slow invocations of LLMs, Retrievers, and other components within your application, enabling you to optimize performance and responsiveness.
- Token Usage: Gain a detailed breakdown of token usage for your LLM calls, allowing you to identify and optimize the most expensive LLM invocations.
- Runtime Exceptions: Capture and inspect critical runtime exceptions, such as rate-limiting events, that can help you proactively address and mitigate potential issues.
- Retrieved Documents: Inspect the documents retrieved during a Retriever call, including the score and order in which they were returned to provide insight into the retrieval process.
- Embeddings: Examine the embedding text used for retrieval and the underlying embedding model to allow you to validate and refine your embedding strategies.
- LLM Parameters: Inspect the parameters used when calling an LLM, such as temperature and system prompts, to ensure optimal configuration and debugging.
- Prompt Templates: Understand the prompt templates used during the prompting step and the variables that were applied, allowing you to fine-tune and improve your prompting strategies.
- Tool Descriptions: View the descriptions and function signatures of the tools your LLM has been given access to in order to better understand and control your LLM’s capabilities.
- LLM Function Calls: For LLMs with function call capabilities (e.g., OpenAI), you can inspect the function selection and function messages in the input to the LLM, further improving your ability to debug and optimize your application.
Features
Projects
Organize traces into separate projects for different applications
Sessions
Group related traces into conversations and user sessions
Annotations
Add feedback, labels, and scores to your traces
Metrics
Monitor latency, token usage, and error rates
Next Steps
Quickstart
Send your first traces to Phoenix
Concepts
Learn how traces and spans work
How-To Guides
Step-by-step tutorials for common tasks
Add Metadata & Tags
Enrich traces with custom attributes for filtering and analysis
Integrations
Connect LangChain, LlamaIndex, Anthropic, and 20+ frameworks
Manual Instrumentation
Add custom spans with decorators and wrappers
Run Evaluations
Score your traces with LLM-as-a-judge evaluators
Advanced Setup
Configure batching, gRPC, headers, and more